Skip to content

Tender Assessment

Tender Assessment is Inoscope's full estimation assessment for large-scale projects. If your pricing is based on drawings, engineering plans, schedules of quantities, specifications, or site visit notes — this is where to start. This assessment type is built for the most complex pricing work.

Bee — Inoscope's autonomous AI Operator — reads all submitted documents and prices the work with a full breakdown of line items, labour hours, and materials. You can price an entire project end-to-end, or scope only the specific work required from a larger project. Whether it is a complete tender or a targeted portion of works, Tender Assessment handles it.

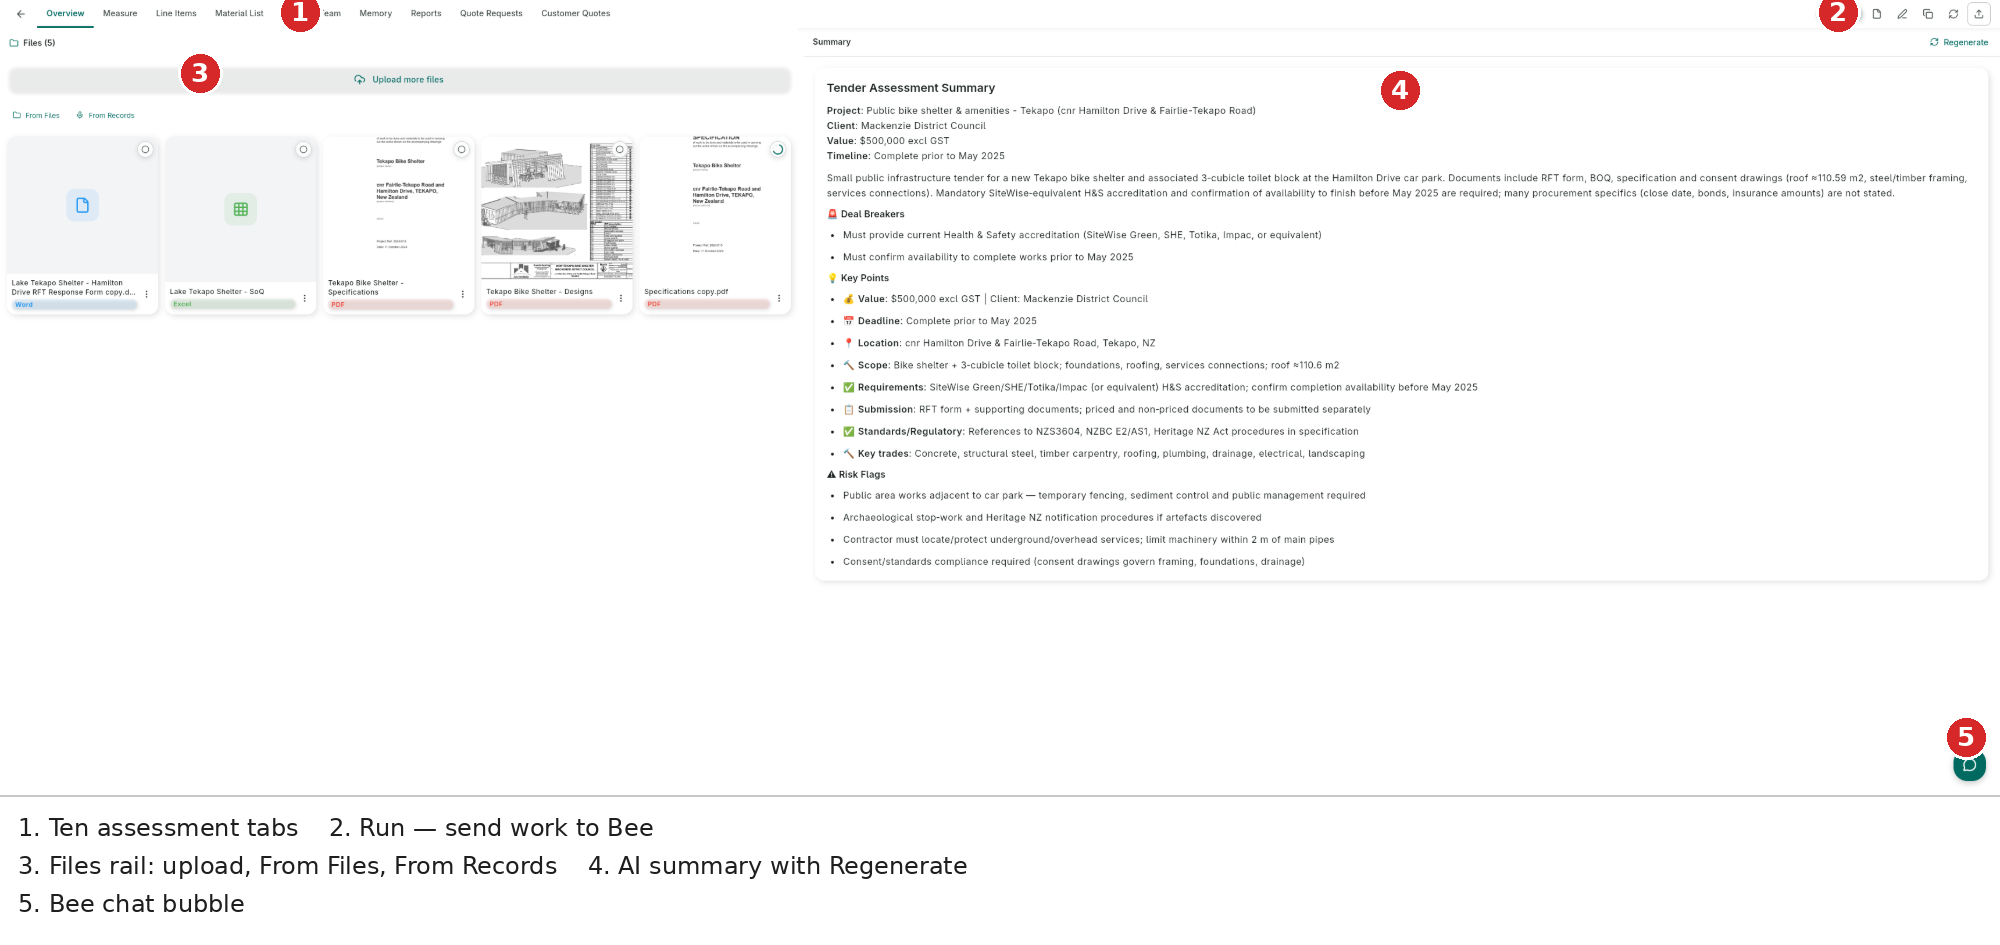
Tender assessment — Overview tab showing uploaded documents on the left and AI-generated project summary on the right


Creating a Tender Assessment

Follow the standard assessment creation flow described in Assessments. When prompted to choose a type, select Tender Assessment.

The same optional fields apply (property, description, date inspected). No damage-event or insurance fields are required for tenders.


Layout

Every tender assessment has a top navigation bar with five tabs and a persistent Inoscope AI Operator panel — where you work with Bee — on the right side of the screen.

Tab Bar

TabPurpose
OverviewUpload tender documents and view the AI-generated project summary
MeasureBrowse documents, annotate drawings, and extract measurements
Line ItemsReview, edit, and manage the full costed hierarchy
FilesList of all uploaded files with status and management actions
TeamManage who has access to the assessment

Header Actions

The right side of the header bar contains five action buttons:

ButtonDescription
Run (play icon)Opens the scope generation dialog to extract and price line items from uploaded documents
Generate Report (document icon)Sends a report generation request to Bee and opens the Inoscope AI Operator panel
Snapshots (copy icon)Create and browse point-in-time copies of the assessment
Refresh (refresh icon)Reload assessment data from the server
Export (export icon)Export the assessment as CSV or Fergus

Inoscope AI Operator Panel

The Inoscope AI Operator panel — where you work with Bee — is always visible on the right side of the screen. It includes:

  • Build / Plan mode toggle in the header
  • Clear and Undock buttons
  • Message history with agent responses
  • Suggestion chips — contextual follow-up prompts after each response
  • Input bar with Attach (paperclip), Voice (mic), and Send buttons

See Inoscope AI Operator for full documentation.


Overview Tab

Tender assessment — Overview tab showing file card on the left and project summary on the right

The Overview tab has two panels side by side.

Left Panel — Documents

Shows all uploaded tender documents as file cards. Three buttons at the top let you add files:

ButtonAction
Upload more filesOpen a file picker to upload PDFs, DOCX, XLSX, CSV, or images
From FilesImport a file already uploaded to the assessment's Files tab
From RecordsAttach a transcript or summary from an audio recording

Each file card shows:

  • File type icon
  • File name and size
  • Processing status badge (green = indexed, orange = processing, red = error)
  • Three-dot menu with Download, Delete, and Reindex options

Right Panel — Project Summary

After files are indexed the AI generates a project summary with three sections:

SectionContent
Deal BreakersCritical risks or conditions that could make the tender unviable
Key PointsImportant requirements, scope highlights, and constraints
Risk FlagsUncertainties, missing information, or items needing verification

A Regenerate button at the top of the panel forces a fresh summary. The summary regenerates automatically when new files are added.


Measure Tab

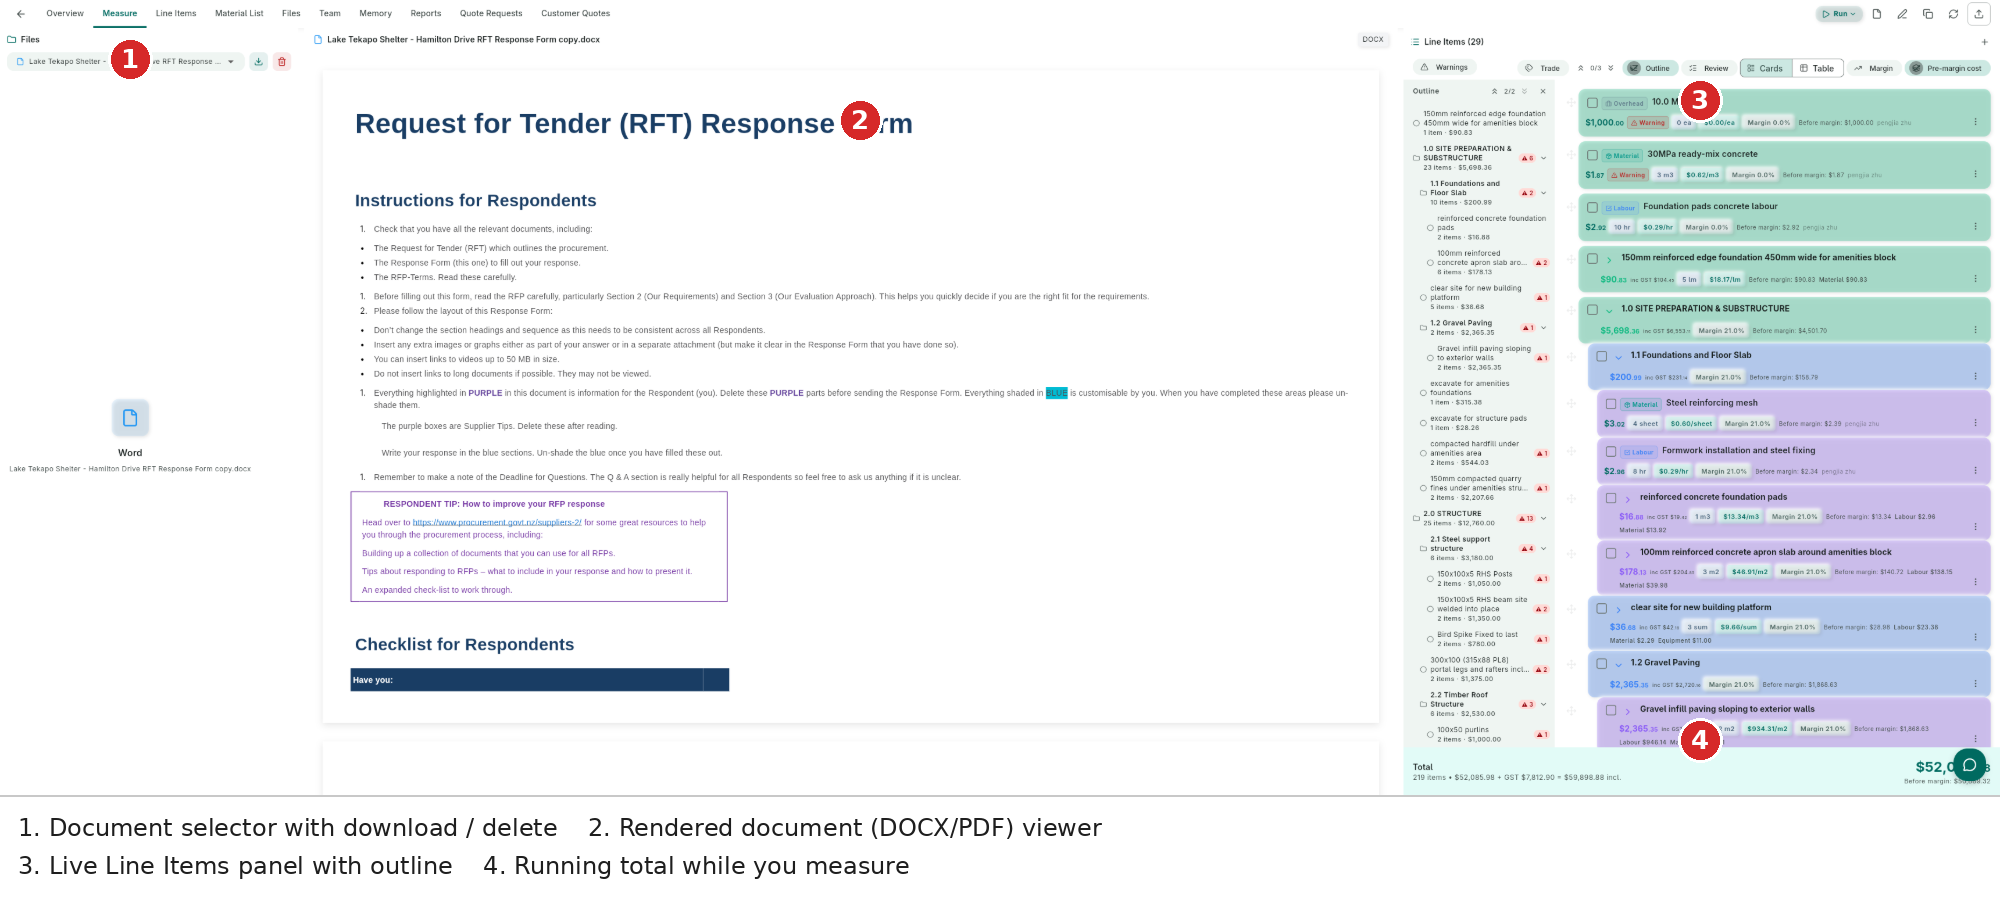
Tender assessment — Measure tab showing three-panel layout: page navigator on the left, document viewer in the center, line items on the right

The Measure tab is a three-panel workspace:

Left Panel — File & Page Navigator

  • File dropdown — switch between uploaded documents
  • Pages section — thumbnail grid of all pages; click a thumbnail to jump to that page
  • Download and Delete buttons for the selected file

Center Panel — Document Viewer

Renders the selected document (PDF, DOCX, XLSX, images, CSV).

The toolbar at the top of this panel contains:

ControlDescription
Measure (ruler icon)Open the measurement calibration overlay for the current page
Zoom out / inDecrease or increase zoom level
Zoom percentageCurrent zoom level display
FitReset zoom to fit the document in the panel

Page navigation arrows and a Page N of M indicator sit at the bottom of the panel.

Right Panel — Line Items

Shows the full hierarchical line item list for this assessment. This is the same data as the Line Items tab, displayed in a compact view alongside the document. An Add line item (+) button is in the panel header, and a Total bar with item count and cost sits at the bottom.


Measurement Calibration

Clicking the Measure (ruler) button in the document viewer toolbar opens the measurement calibration overlay — a full-screen workspace that combines drawing annotation tools with the Inoscope AI Operator panel.

Measurement calibration is used to verify critical dimensions on a drawing and apply the corrected values to existing measurements, line items, and their related items. Calibrating directly against the drawing scale increases the accuracy of Inoscope's autonomous pricing output — correcting one measurement propagates through every dependent quantity and cost.

Tender assessment — Measurement calibration overlay showing drawing toolbar, polygon annotation with computed dimensions on the site plan drawing, and AI chat response on the right

Drawing Toolbar

ToolDescription
SelectSelect and reposition existing annotations
DrawFreehand annotation
EraseRemove individual annotations
LineDraw a straight line
RectangleDraw a rectangular box or area
PolygonDraw a multi-point closed shape
MovePan the canvas
Zoom In / Zoom OutZoom the document
ResetReset zoom and pan to default
Undo / RedoStep through annotation history
ClearRemove all annotations

A scale chip (e.g., 1:150 A3) in the top-right of the toolbar shows the scale detected from the drawing. The AI reads this automatically when calculating real-world dimensions.

Always verify the detected scale before measuring

Check that the scale chip matches the scale printed on your drawing before annotating or requesting measurements. If Inoscope detects the wrong scale, all calculated dimensions and quantities will be inaccurate. If the scale chip is incorrect, you can manually set the correct scale before proceeding.

Running a Calibration

  1. Navigate to the drawing page using the page thumbnails on the left.
  2. Click Measure in the document viewer toolbar.
  3. Annotate the area you want to calibrate — for example, use Polygon to outline a room or Line to mark a wall run.
  4. In the Inoscope AI Operator panel on the right, describe what you want:
    • "Calibrate the floor area of the polygon I drew and apply it to the flooring line items"
    • "Verify the perimeter of the outlined zone and update any skirting or wall items"
    • "Use the scale bar to check the room dimensions, then update related quantities"
  5. The AI reads your annotations and the detected drawing scale, returns the calibrated value with a step-by-step explanation, and updates existing line items and their related items. Computed dimensions are displayed as overlays directly on the drawing.

Click Close measurement (the X button in the top-left) to exit the overlay and return to the Measure tab.


Line Items Tab

Tender assessment — Line Items tab showing hierarchical cost breakdown with groups and leaf items

The Line Items tab shows the full costed hierarchy.

Header Controls

ControlDescription
SearchFilter items in real time by name
Collapse all (down-arrow icon)Close all GROUP items
Expand all (up-arrow icon)Open all GROUP items to show children
+ Add ItemOpen the Add Line Item dialog to create a cost item manually

Hierarchy Structure

Line items are organized as a tree of groups and leaf items:

Site Works (Group)
  ├── Site Clearance          476 m²   $0.00/m²   $0.00
  ├── Bulk Earthworks         300 m²   $0.00/m²   $0.00
  ├── Site Drainage           1 lot    $0.00/lot   $0.00
  └── Site Services Connection  1 lot  $0.00/lot   $0.00
Substructure (Group)
  ├── Concrete Slab & Footings  188.51 m²  $0.00/m²  $0.00
  └── Under-Slab Services     1 lot    $0.00/lot   $0.00
  • Group rows (shaded) are section headers; their cost is the sum of all children. They show a child-count badge and can be expanded/collapsed.
  • Leaf rows are the actual cost items (Material, Labour, Equipment, Subcontract, Overhead, Site Service). Each shows quantity, unit, unit price, and total cost.
  • A Warning badge appears on items that have not yet been priced or have other issues.
  • Costs roll up automatically — editing a child immediately updates all parent totals.

Item Row Actions

Each row has three buttons on the right:

ButtonAction
Edit (pencil)Open the edit dialog to change name, quantity, unit price, margin, discount, or notes
Delete (circle-minus)Remove the item (groups: removes all children too)
More (three-dot)Additional options

Cost Formula

Cost = Unit Price × Quantity × (1 + Margin) × (1 - Discount)

Total Bar

A sticky bar at the bottom always shows:

N Items • $0.00 + GST $0.00 = $0.00 incl.

Files Tab

Tender assessment — Files tab listing uploaded documents with type, size, and upload date

The Files tab lists every file attached to the assessment. Each row shows:

  • File name with type icon
  • File type (PDF, DOCX, etc.)
  • Size
  • Upload date
  • Download and Delete buttons

An Upload files button at the top lets you add more files directly from this tab.


Team Tab

Tender assessment — Team tab showing members list with Name, Email, and Role columns

The Team tab controls who can access the assessment.

  • Search users — filter the members list
  • + Add User — invite a user by email and assign a role
RolePermissions
OwnerFull access — edit, delete, manage team
AdminEdit content and manage team
EditorAdd and modify line items, files, and content
ViewerRead-only
ContributorAdd content but cannot modify existing items

See Team Collaboration for full instructions.


Run Scope Generation

The Run button in the header launches a 7-step process that reads all indexed documents and produces a fully-costed line item hierarchy. Run processes every document in one automated batch — ask Bee in the Inoscope AI Operator panel to refine results, re-price individual items, or answer questions after Run completes. For a full comparison, see Run vs Bee.

Tender assessment — Run scope generation dialog with free-text instruction field and Run button

Starting a Run

  1. Upload your tender documents in the Overview tab and wait for all status badges to turn green.
  2. Click the Run button in the header.
  3. The dialog asks "What would you like to do?"
    • Enter a custom instruction (e.g., "Focus on civil works only" or "Use Christchurch rates"), or
    • Leave it blank to run with default settings.
  4. Click Run.

The assessment navigates to the Line Items tab automatically and a status chip in the header shows Run progress.

Run Steps

StepWhat It Does
1. ExtractReads all indexed documents and pulls out every line item with its hierarchy, quantities, and units
2. SplitBreaks composite items into separate Material, Labour, and Equipment children
3. ConsolidateMerges duplicate equipment items shared across sections (e.g., scaffolding)
4. SequenceDetects construction dependencies between items
5. PricePrices each item — materials, labour, equipment hire, and more — prioritising your calibrated user data first, then curated Inoscope data, then wider available sources such as internet and research data
6. TotalCalculates the full assessment total and all group subtotals
7. ValidateChecks whether pricing matches industry-common data against local and national benchmarks, verifies material usage and fitness for purpose, cross-references measurements, and checks all assumptions — any issues are flagged as warnings for your review

To stop Run mid-way, click the red stop circle that appears in the Inoscope AI Operator panel's input bar.


Snapshots

Snapshots dialog — list of saved snapshots with timestamps

Snapshots are Inoscope's pricing version management and audit trail — all in one. Each snapshot creates a read-only, unmodifiable record of the assessment at that point in time. Users can define their own uses for snapshots, such as:

  • Changing a calculation method and comparing the result before and after
  • Running a different pricing scenario alongside the original for comparison
  • Preserving the current state before a major re-pricing or re-run

To revert to a previous snapshot, simply ask Bee to revert back. This will apply the snapshot's data as a new change — meaning the revert itself is recorded in the audit trail, so every action remains fully traceable.

Creating a snapshot:

  1. Click the Snapshots button in the header.
  2. Click + Create Snapshot in the dialog.
  3. A "Snapshot created successfully" confirmation appears and the snapshot is added to the list with a timestamp.

Viewing a snapshot:

  1. Open the Snapshots dialog.
  2. Click any snapshot in the list (10 per page, ordered newest first).
  3. The snapshot opens with a "Snapshot - Read Only" banner at the top of the screen. Editing is disabled, the Run button is hidden, and Inoscope AI Operator is not available.

Snapshot view — "Snapshot - Read Only" banner with editing and chat disabled

  1. Use the back arrow to return to the live assessment.

Export

Click the Export button in the header to export the assessment.

FormatDescription
CSVFlat or grouped spreadsheet of all line items
FergusJob import for Fergus job management

See Export & Integrations for format-specific configuration.


Best Practices

Upload all documents before running — wait for all status badges to turn green in the Overview tab before clicking Run. The AI cross-references the full document set in one pass.

Attach site notes via "From Records" — if you have site visit recordings in the Records section, attach their transcripts. The AI incorporates site-specific conditions into pricing.

Use Plan mode for large SOQs — switch Bee to Plan mode before asking it to extract or price a document with hundreds of items. Review the step-by-step plan before Bee makes any changes.

Review the hierarchy before pricing — after extraction, expand the full hierarchy in the Line Items tab and check that section groupings match your expected structure before asking Bee to price.

Snapshot before re-running — create a snapshot before clicking Run a second time so you can compare against the previous result.

Reference the project location explicitly — if the assessment has no property address, include the location in your prompt: "This project is in Wellington, NZ — use Wellington rates."


Next Steps